PCS® Insights
Sharing Industry Knowledge, Lessons-Learned and Published Presentations
What Does Cholera Have to Do with Pipelines?
The Unexpected Upside of Poor Pipe Maintenance
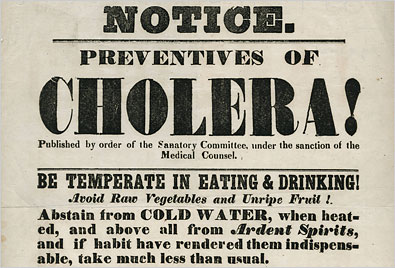
1854 was not a good year for Soho. It was a lower class neighborhood in London, plagued by crowding, bad sanitation, and a stench of historic proportions. In late August, panic set in as a particularly vicious strain of cholera blazed through the local population. In the first ten days, 500 people died. A basic primer on cholera: it is not fun, it is messy, and it can be highly contagious. To reiterate: it was not a good year for Soho.
At the time, the miasma theory of disease was the accepted—and incorrect—belief that illnesses were transmitted by polluted air. In other words, breathing in London was like playing Russian roulette. The smell was most unbearable in poor districts like Soho, where cesspools accumulated outside of houses and cellars slowly filled with raw sewage. London’s ancient sewer system simply could not handle the volume of waste.
Dr. John Snow: A Man with a Plan
Officials attributed the epidemic to the usual miasma, but Dr. John Snow, a Soho resident, suspected otherwise. He had worked in previous outbreaks and had noticed that cholera attacked the digestive system. Clearly, people were eating or drinking something that was giving them cholera. Snow’s revolutionary—and correct—hypothesis was not popular. No one would take him seriously. So, he set out to prove that he was right.
As the death toll steadily mounted, Dr. Snow began to note the spatial relationships between the fatalities. He soon realized that the deaths were clustered around the Broad Street pump and that they dropped off rapidly the further one moved away from the water source. Eager to build a case, Dr. Snow and a colleague began to interview the survivors, trying to ascertain both their drinking habits and those of the dead. Unsurprisingly, almost all of the dead or infected favored the water from Broad Street.
He presented his findings to the local authorities and requested that they remove the handle to the Broad Street pump. Desperate to try any suggestion, they did so a week after the first cholera death. Over the course of the following fortnight, the outbreak subsided. The numbers were shocking: in less than two weeks, almost 700 people who lived within less than 250 yards of the pump had died.
Several months later, Snow created his now-famous maps of the outbreak. In the first version of the map, Snow used dots to show the distribution of death in the neighborhood. All that was marked on the map were streets, fatalities, and water pumps. Black bars indicated deaths, making it easy to understand the spatial relationship between fatalities and the water pumps in the area. The pattern was striking: the density was unmistakably highest around Broad Street.
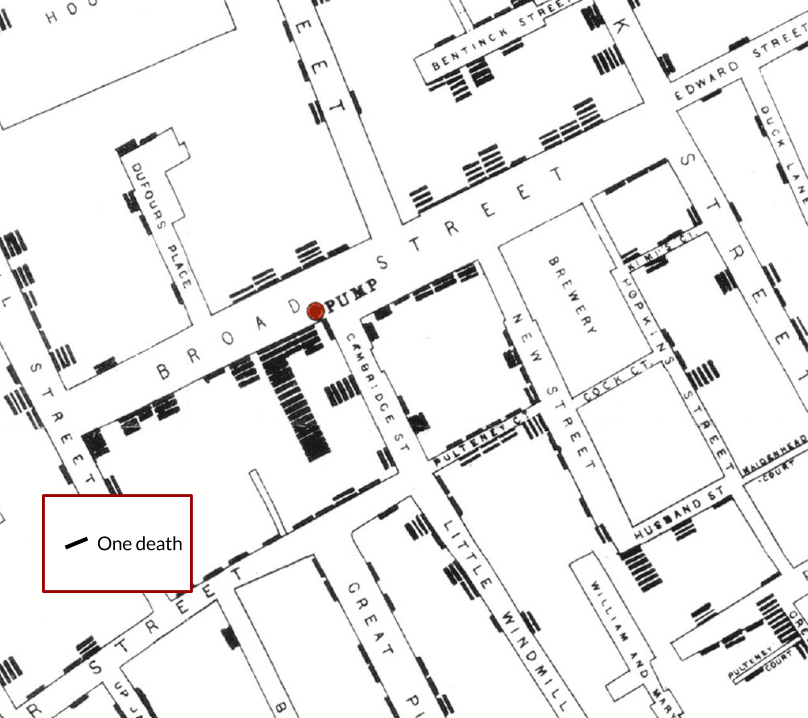
A section of John Snow’s first map of cholera fatalities near the Broad Street pump
Snow realized that critics could look at the map and claim that water had nothing to do with it; perhaps Broad Street was just lethally rank. Tired of the same back-and-forth, he made a second version of the map in early 1855.
This time, Dr. Snow got serious. He employed network analysis to calculate which water pump was closest to each house. The stroke of genius: he based it on walking distance, not as-the-crow-flies distance. He then used polygons to demarcate areas based on those findings. Because he added foot traffic to the equation, the output yielded a shape that clearly illustrated the relationship between human movement and disease. It was impossible to deny the high concentration of fatalities in the population that was drinking Broad Street water. Dr. Snow’s second map helped convince the local authorities that cholera was waterborne.
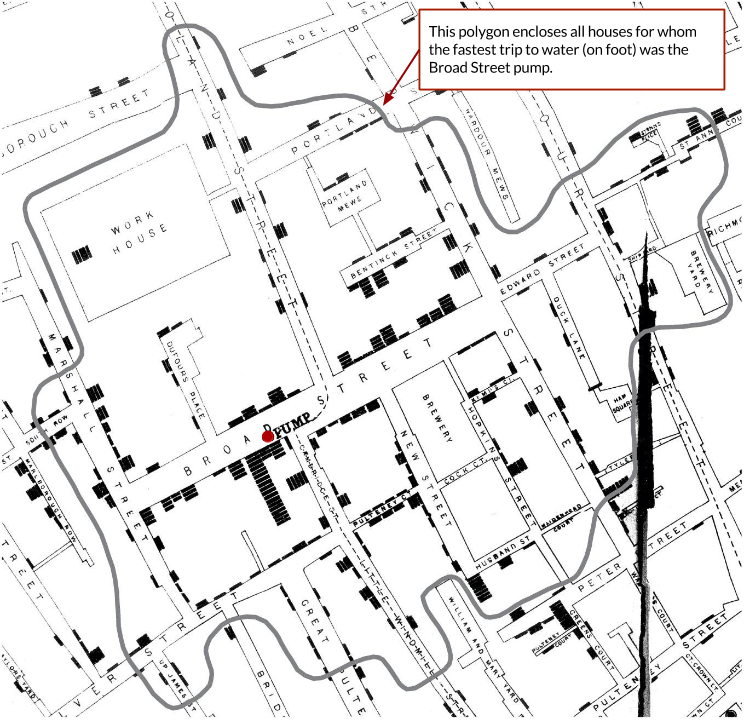
A section of John Snow’s second map of cholera fatalities near the Broad Street pump, using polygons
And so, John Snow can be credited with one of the first uses of a Geographic Information System (GIS) and geospatial analysis. He gathered sets of data from different sources, combined them on a map, and analyzed the spatial (and temporal) relationships amongst them. In doing so, he proved his hypothesis correct. What’s even more impressive—at least to us modern GIS analysts—is that he did it without the help of software, GPS, or even an electronic calculator.
What is GIS?
Today, GIS has evolved into a powerful, multifaceted platform that is leveraged across a variety of industries. It is not just for getting directions to the store or finding the dot marked “You Are Here”. Geospatial analysis is used for everything from crime analysis to disaster management.
But why tell you when we can show you? It’s much more interesting this way:
![]()
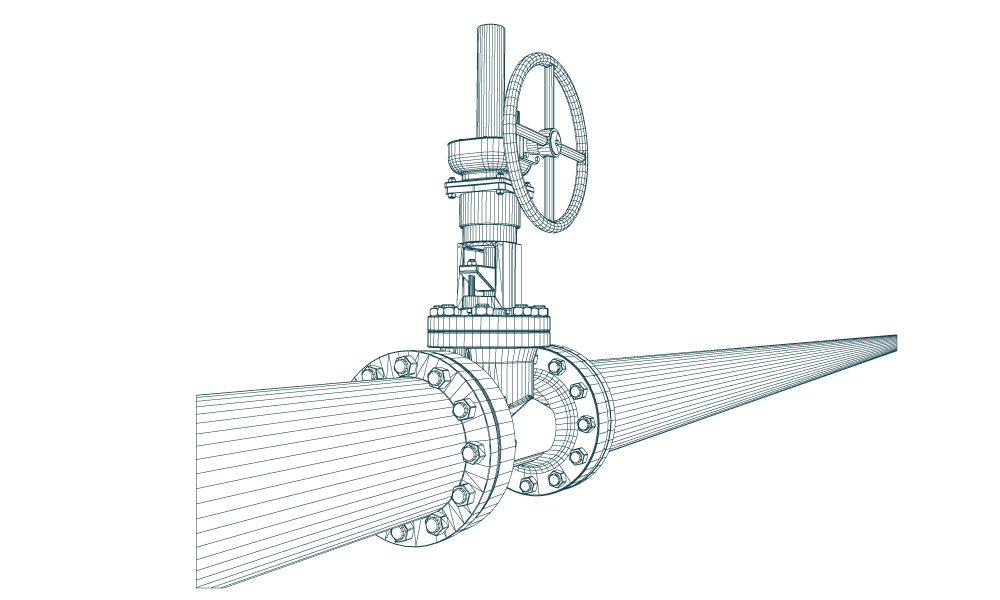
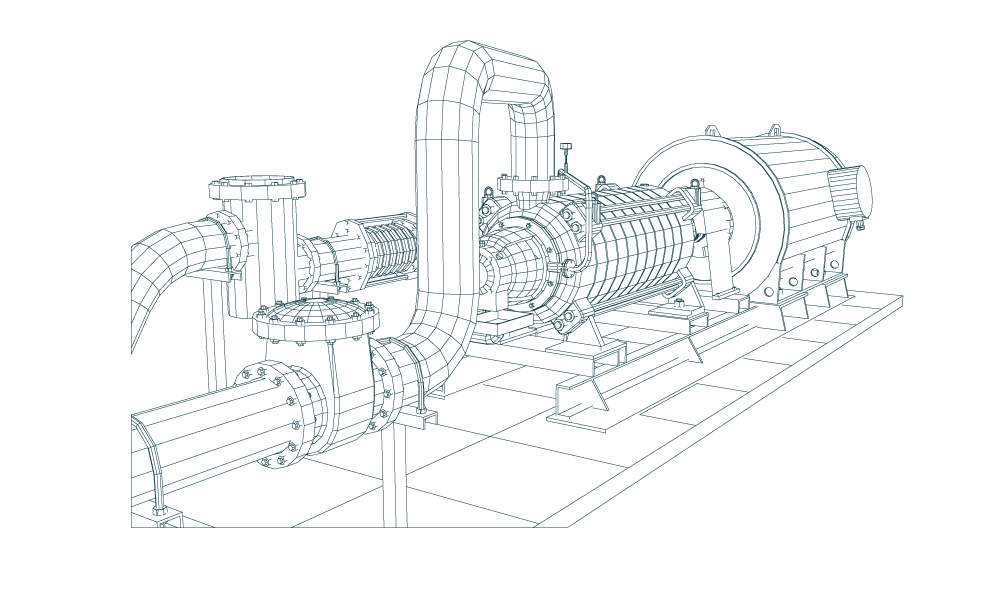
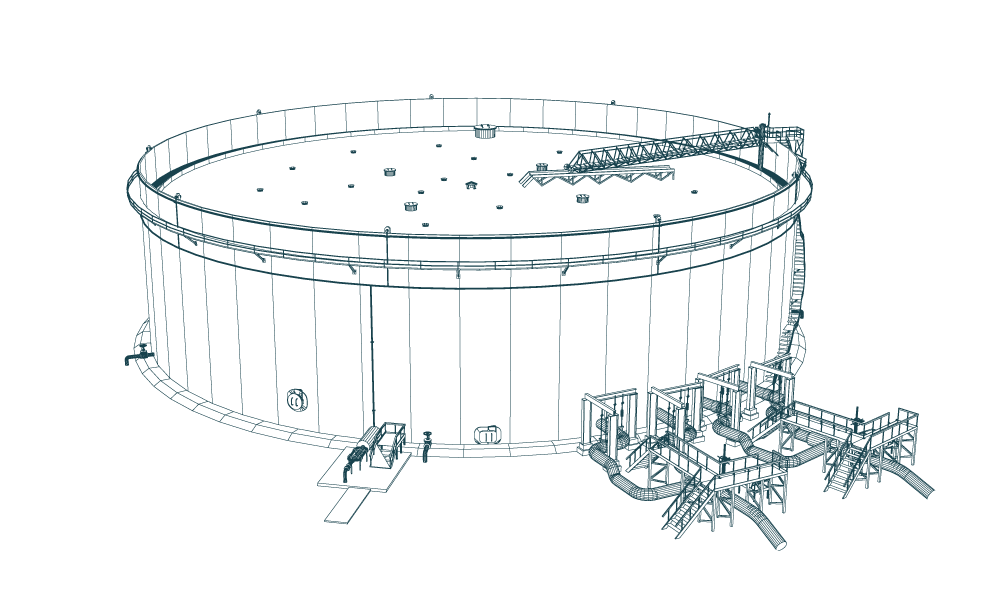
GIS in Pipelines
So, what does cholera have to do with pipelines? The 1854 Broad Street cholera outbreak was one of the founding events of the modern field of geospatial analysis and GIS. Today, GIS has been embraced by the pipeline industry. This comes as no surprise given the need for spatial awareness in oil and gas exploration, pipeline design and construction, and environmental impact assessment. Aside from map design and data visualization, GIS is also used for data organization, management, and analysis. It is a valuable tool throughout the entire lifecycle of a pipeline, from conception to decommission.
On a daily basis, GIS facilitates quality control and quality assurance of pipeline survey data. This in turn speeds up alignment and profile sheet generation. GIS analysts ensure that all data is correct and accounted for, allowing construction to progress as smoothly as possible. The technology’s capabilities extend much further: important tasks such as developing project material quantity takeoff and creating weld stationing can be achieved through a geospatial platform. To accommodate client needs, GIS specialists can develop custom tools that combine engineering expertise with the power of GIS. For example, we have created a Class Location Analysis tool that can quickly analyze a pipeline route based upon the class location design and safety standards defined in CFR Part 192.5. We can then assign the appropriate pipeline materials to the route based upon the tool’s results, ensuring the route design maintains the required pipe material specifications.
There are many benefits to utilizing geospatial services, but the real value of the GIS framework is that it promotes vertical integration across a company. It can process data from multiple formats and sources (e.g. Excel spreadsheets, GPS points, CAD files, etc.), allowing collaboration within different groups and departments. In turn, this provides a one stop shop for clients.
In following installments we are going to map out (see what we did there?) and explore how this technology can be used to leverage resources, empower decision making, cut down costs, improve communication, and facilitate data management.
Cholera in Pipelines
Finally, we must answer the most burning question of all: what was the direct cause of the Broad Street epidemic? In short: poorly maintained pipe and well infrastructure. After Snow and his colleagues convinced the authorities that water was to blame, investigators discovered that the first cholera case in the neighborhood was at a house next to the Broad Street well. Because the pipe leading from the house to the sewer was backed up, the victim’s...symptoms...sat in the cesspool under the house. The cesspool was less than 3 feet away from the well. The walls of the well consisted of crumbling brick. The soil in the surrounding area was saturated with human waste. The water in the well was, to put it lightly, heavily contaminated. People drank the water, got sick, and accidentally made history.
SOURCES
Johnson, Steven. The Ghost Map. New York: Penguin Group, 2006.
Esri. What is GIS? Retrieved from http://www.esri.com/what-is-gis
Esri. GIS Dictionary. Retrieved from http://support.esri.com/en/knowledgebase/Gisdictionary/browse
Article Details
Author: Allegra Yeley & Steve Padgett Vasquez
GIS Analysts
PCS® Atlanta
More Information
Contact Us
We would appreciate any opportunity to assist you, and to connect you with the right person at PCS ® to address your needs and answer any questions.
Request Info Call Us 1-800-643-8306